最近在测试系统的Benchmark的时候,遇到一个奇怪的现象: 有少许请求的总处理时间特别长。后来发现耗时基本处在connect to server上。
奇怪的是,耗时较长的连接所用的时间基本还有规律, 大概是1秒,3秒,7秒,15秒.....这样有规律的数列,而且耗时越长的连接数量越少。
测试结果分析
我们的服务基本是一个部署在tomcat 7上的仅仅提供Restful API的web应用程序, 业务不是很复杂。 我使用ApacheBench性能测试工具进行Benchmark测试。
并发数选取500,测试脚本也很简单:
1 2 3 4 5 6 7 8
| rm -fr esam.dat rm -f *.jpg ab -q -g data.dat -c 500 -n 100000 -H 'Accept:application/xml' -p request.xml -T 'application/xml' http://ip:port/app/service1 gnuplot conn.p gnuplot process.p gnuplot totaltime.p
|
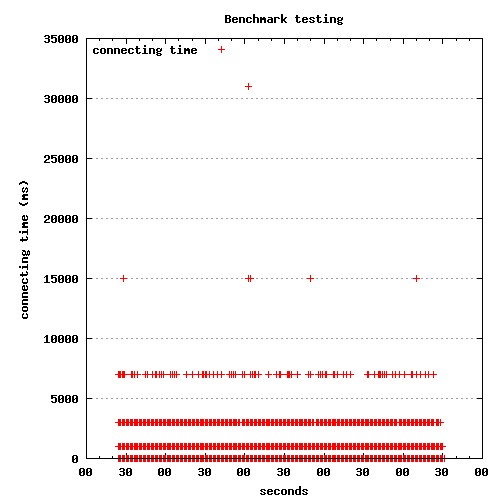
使用gnuplot将结果绘制成散列图。
1 2 3 4 5 6 7 8 9 10 11 12 13 14 15 16 17 18 19 20 21 22 23 24 25 26 27
| set terminal jpeg size 500,500 set size 1, 1 set output "connect.jpg" set title "Benchmark testing" set key left top set grid y set xdata time set timefmt "%s" set format x "%S" set xlabel 'seconds' set ylabel "connecting time (ms)" set datafile separator '\t' plot "data.dat" every ::2 using 2:3 title 'connecting time' with points exit
|
从结果图上看处理时间比较少,分布也很好(大概是正态分布的样子)。 ApacheBench的统计报告也显示服务器处理时间没问题, 那些耗时花费在connect上。
1 2 3 4 5 6 7 8 9 10 11 12 13 14 15 16 17 18 19 20 21 22 23
| Concurrency Level: 500 Time taken for tests: 247.979 seconds Complete requests: 1000000 Failed requests: 10 (Connect: 0, Receive: 0, Length: 10, Exceptions: 0) Write errors: 0 Total transferred: 1795997576 bytes Total POSTed: 1061006366 HTML transferred: 1662997443 bytes Requests per second: 4032.60 [ Time per request: 123.990 [ms] (mean) Time per request: 0.248 [ms] (mean, across all concurrent requests) Transfer rate: 7072.79 [Kbytes/sec] received 4178.33 kb/s sent 11251.12 kb/s total Connection Times (ms) min mean[+/-sd] median max Connect: 0 78 367.1 0 15001 Processing: 2 46 45.2 28 1593 Waiting: 2 46 45.2 28 1593 Total: 2 124 371.9 29 15097
|
服务器端检查
现在将问题的焦点集中在为什么以小部分的连接为什么慢这个问题上。
dstat随时监控着服务器的网络流量,读写基本都在10M左右,压力不大。
查看Tomcat NIO的实现。 Tomcat的NIO的实现还是比较特殊的。
Tomcat的NioEndpoint.Acceptor用来接受来自客户端的连接。
SocketChannel socket = serverSock.accept();
尽管代码中有pause(1000)的处理,但是只是在tomcat stop的时候调用。 只要网络条件允许, Tomcat应该能正常建立连接, 不会主动暂停接收连接请求。
keep-alive的影响
监控服务器的连接数时发现测试时有大量的TCP连接建立和关闭。 没有利用HTTP的持久连接机制。
既然问题在于建立连接超时,那么只维持一定数量的连接应该可以避免这种问题。
Tomcat的配置中调整keep-alive相关的参数, ab的测试脚本中加入-k参数, 重新测试。
果不其然, 没有出现1秒,3秒这样跳跃的耗时长的请求。
根源
为什么会出现部分耗时长的连接呢?
理论上好的网络条件下同一局域网内的服务器之间连接时间基本小于1毫秒, 除非三次握手不成功,TCP重试握手过程。
查找Linux 关于TCP/IP协议栈的参数的配置, 发现有几个相关的重试的参数:
1 2 3 4
| tcpsyn_retries tcp_synack_retries tcp_retries1 tcp_retries2
|
从客户端的角度分析, 我们可以看一下tcpsyn_retries这个参数。
对于一个新建连接,内核要发送多少个 SYN 连接请求才决定放弃。不应该大于255,默认值是5,对应于180秒左右时间。
如果将这个值设为1, 测试建立connect时就会出现timeout的现象, 而不是等待1秒 ,3秒......才建立连接。
问题弄清楚了,在大量的短连接情况下, 部分的连接会出现三次握手不成功的现象。 如果握client发现握手在Linux配置的时间范围之内,TCP client还是会重试连接, 超出范围将会报连接超时。
为什么是1,3,7,15......这样的数列?
这和Linux TCP/IP协议栈的实现相关。
tcp_timer.c
中计算超时时间:
1
| ((2 << boundary) - 1) * rto_base
|
基本是按照\(2^n -1\)这样的时间来计算。
