在命令行中使用Eclipse MAT工具

最近应用在测试中出现Out Of Memory的问题, 通过jmap查看,发现JVM heap全用满了。
有很多工具可以查看JVM堆的信息, 收费的比如JProfiler, YourKit,免费的如Oracle JDK自带的visualvm, jhat和Eclipse MAT。
这个应用安装在一台AWS上,没有图形界面, 内存也比较小,想通过VNC远程桌面启动visualvm或者MAT不可能,通过jhat分析dump出来的snapshot(大约4.3G)也很慢,半天没有分析完毕,这种办法也放弃。
最后通过MAT的命令行工具分析了dump出来的snapshot,查找到OOM的元凶。

使用MAT命令行工具

首先通过jstat或者jmap查看heap信息,比如通过jmap查看:

1
2
3
4
5
6
7
8
9
10
11
12
13
14
15
16
17
18
19
20
21
22
23
24
25
26
27
28
29
30
31
32
33
34
35
36
37
38
39
40
41
42
43
JVM version is 25.31-b07
using thread-local object allocation.
Parallel GC with 4 thread(s)
Heap Configuration:
MinHeapFreeRatio = 0
MaxHeapFreeRatio = 100
MaxHeapSize = 4294967296 (4096.0MB)
NewSize = 1431306240 (1365.0MB)
MaxNewSize = 1431306240 (1365.0MB)
OldSize = 2863661056 (2731.0MB)
NewRatio = 2
SurvivorRatio = 8
MetaspaceSize = 21807104 (20.796875MB)
CompressedClassSpaceSize = 1073741824 (1024.0MB)
MaxMetaspaceSize = 17592186044415 MB
G1HeapRegionSize = 0 (0.0MB)
Heap Usage:
PS Young Generation
Eden Space:
capacity = 482344960 (460.0MB)
used = 468288384 (446.5946044921875MB)
free = 14056576 (13.4053955078125MB)
97.08578358525816% used
From Space:
capacity = 278921216 (266.0MB)
used = 0 (0.0MB)
free = 278921216 (266.0MB)
0.0% used
To Space:
capacity = 477102080 (455.0MB)
used = 0 (0.0MB)
free = 477102080 (455.0MB)
0.0% used
PS Old Generation
capacity = 2863661056 (2731.0MB)
used = 2863365080 (2730.7177352905273MB)
free = 295976 (0.28226470947265625MB)
99.98966441927965% used
12340 interned Strings occupying 1051736 bytes.

最多的类的实例:

1
2
3
4
5
6
7
8
9
10
11
12
13
14
num #instances #bytes class name
----------------------------------------------
1: 21606534 1530253752 [C
2: 21606239 518549736 java.lang.String
3: 19198980 460775520 scala.collection.immutable.ListSet$Node
4: 4568546 109645104 scala.collection.immutable.HashSet$HashSetCollision1
5: 103739 63212992 [B
6: 1487034 53464560 [Lscala.collection.immutable.HashSet;
7: 1487034 35688816 scala.collection.immutable.HashSet$HashTrieSet
8: 1350368 32408832 scala.collection.immutable.$colon$colon
9: 1090897 26181528 scala.collection.immutable.HashSet$HashSet1
10: 200035 17603080 akka.actor.ActorCell
11: 100536 8042880 java.lang.reflect.Constructor
12: 500026 8000416 scala.runtime.ObjectRef

从分析来看猜测是akka actor mailbox里面的字符串消息太多了。

既然没有办法图形化启动visualvm和MAT,那么就使用MAT文件夹下的ParseHeapDump.sh, 特别适合分析大堆的信息。
首先你需要修改MemoryAnalyzer.ini中的Xmx值,确保有充足的硬盘空间(至少dump文件的两倍)。
然后运行

1
./ParseHeapDump.sh heap.bin org.eclipse.mat.api:suspects org.eclipse.mat.api:overview org.eclipse.mat.api:top_components

会得到suspects, overview和top_components三个视图的信息。
有问题的对象
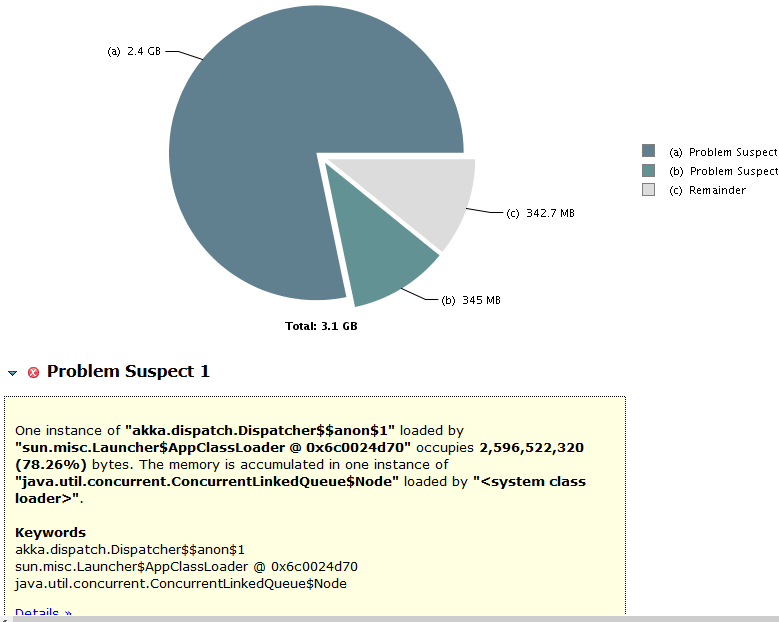
可以看到akka.dispatch.Dispatcher$$anon$1一个实例占用了2.4GB的内存,这就是罪魁祸首。这其实是akka dispatcher的mailbox中的java.util.concurrent.ConcurrentLinkedQueue,每个Node占用了81M的内存,
消息体太大了。

编写程序得到所需信息

你也可以引用MAT的类,得到heap dump中的信息, 因为MAT使用Eclipse RCP框架, 基于osgi架构,使用起来不太方便,所以你可以别人抽取出来的MAT库,如https://bitbucket.org/joebowbeer/andromat,
然后实现一个命令行程序,比如下面的例子就是输出所有的字符串的值:

1
2
3
4
5
6
7
8
9
10
11
12
13
14
15
16
17
18
19
20
21
22
23
24
25
26
27
28
29
30
31
32
33
34
35
36
37
38
39
40
41
42
43
44
45
46
47
48
49
50
51
52
package com.colobu.mat;
import org.eclipse.mat.SnapshotException;
import org.eclipse.mat.parser.model.PrimitiveArrayImpl;
import org.eclipse.mat.snapshot.ISnapshot;
import org.eclipse.mat.parser.internal.SnapshotFactory;
import org.eclipse.mat.snapshot.model.IClass;
import org.eclipse.mat.snapshot.model.IObject;
import org.eclipse.mat.util.ConsoleProgressListener;
import org.eclipse.mat.util.IProgressListener;
import java.io.File;
import java.io.IOException;
import java.util.Collection;
import java.util.HashMap;
public class Main {
public static void main(String[] args) throws SnapshotException, IOException {
String arg = args[args.length - 1];
String fileName = arg;
IProgressListener listener = new ConsoleProgressListener(System.out);
SnapshotFactory sf = new SnapshotFactory();
ISnapshot snapshot = sf.openSnapshot(new File(fileName),
new HashMap<String, String>(), listener);
System.out.println(snapshot.getSnapshotInfo());
System.out.println();
String[] classNames = {"java.lang.String"};
for (String name : classNames) {
Collection<IClass> classes = snapshot.getClassesByName(name, false);
if (classes == null || classes.isEmpty()) {
System.out.println(String.format("Cannot find class %s in heap dump", name));
continue;
}
assert classes.size() == 1;
IClass clazz = classes.iterator().next();
int[] objIds = clazz.getObjectIds();
long minRetainedSize = snapshot.getMinRetainedSize(objIds, listener);
System.out.println(String.format("%s instances = %d, retained size >= %d", clazz.getName(), objIds.length, minRetainedSize));
for (int i = 0; i < objIds.length; i++) {
IObject str = snapshot.getObject(objIds[i]);
String address = Long.toHexString(snapshot.mapIdToAddress(objIds[i]));
PrimitiveArrayImpl chars = (PrimitiveArrayImpl) str.resolveValue("value");
String value = new String((char[]) chars.getValueArray());
System.out.println(String.format("id=%d, address=%s, value=%s", objIds[i], address, value));
}
}
}
}

基本上使用ParseHeapDump.sh已经得到了我所需要的结果,优化akka actor消息的内容解决了我的问题。

参考文档

  1. https://wiki.eclipse.org/MemoryAnalyzer/Extending_Memory_Analyzer
  2. http://javaforu.blogspot.jp/2013/11/analyzing-large-java-heap-dumps-when.html
  3. http://dr-brenschede.de/bheapsampler/
  4. http://www.techpaste.com/2015/07/how-to-analyse-large-heap-dumps/
  5. http://stackoverflow.com/questions/15977723/analyse-a-hprof-memory-dump-file-from-command-line-programmically
  6. http://wangjunyan.github.io/2014/12/02/export-android-bitmap-from-dump-file/