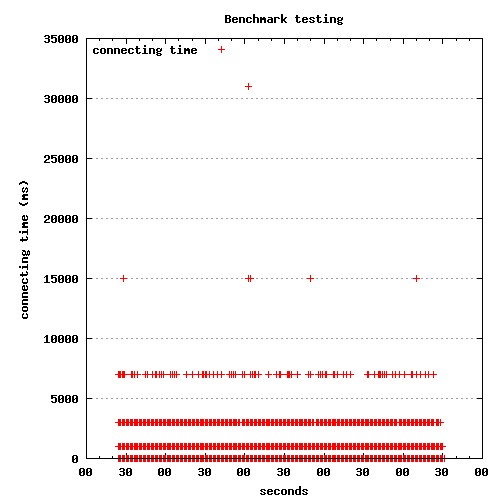
# output to a jpeg file
set terminal jpeg size 500,500
# This sets the aspect ratio of the graph
set size 1, 1
# The file we'll write to
set output "connect.jpg"
# The graph title
set title "Benchmark testing"
# Where to place the legend/key
set key left top
# Draw gridlines oriented on the y axis
set grid y
# Specify that the x-series data is time data
set xdata time
# Specify the *input* format of the time data
set timefmt "%s"
# Specify the *output* format for the x-axis tick labels
set format x "%S"
# Label the x-axis
set xlabel 'seconds'
# Label the y-axis
set ylabel "connecting time (ms)"
# Tell gnuplot to use tabs as the delimiter instead of spaces (default)
set datafile separator '\t'
# Plot the data
plot "data.dat" every ::2 using 2:3 title 'connecting time' with points
exit
Concurrency Level:      500
Time taken for tests:   247.979 seconds
Complete requests:      1000000
Failed requests:        10
   (Connect: 0, Receive: 0, Length: 10, Exceptions: 0)
Write errors:           0
Total transferred:      1795997576 bytes
Total POSTed:           1061006366
HTML transferred:       1662997443 bytes
Requests per second:    4032.60 [#/sec] (mean)
Time per request:       123.990 [ms] (mean)
Time per request:       0.248 [ms] (mean, across all concurrent requests)
Transfer rate:          7072.79 [Kbytes/sec] received
                        4178.33 kb/s sent
                        11251.12 kb/s total


Connection Times (ms)
              min  mean[+/-sd] median   max
Connect:        0   78 367.1      0   15001
Processing:     2   46  45.2     28    1593
Waiting:        2   46  45.2     28    1593
Total:          2  124 371.9     29   15097